16 min read
Introduction
I was three months into my first SaaS startup when an investor asked a simple question: “What’s your LTV:CAC ratio?”
I had no idea.
I knew our revenue. I knew how many customers we’d signed. But I couldn’t tell you whether we were building a sustainable business or a slowly sinking ship.
That meeting ended early. The investor passed. And I spent the next week learning something I should have understood on day one: SaaS metrics aren’t just numbers. They’re the language of your business.
If you’re reading this, you’re probably where I was—building something real, but realizing you need to understand the numbers behind it. Good. That awareness puts you ahead of most founders.
This guide isn’t a dictionary. It’s a framework. By the end, you’ll know exactly which metrics matter at your stage, how to calculate them, and—most importantly—what to do when the numbers tell you something’s wrong.
This guide is part of the Automaiva SaaS Growth System, a framework we’ve built to help founders master the core pillars of a scalable business. Mastering your metrics is the first step. For a complete overview of how metrics fit into your tech stack, explore our SaaS Growth Stack Guide.
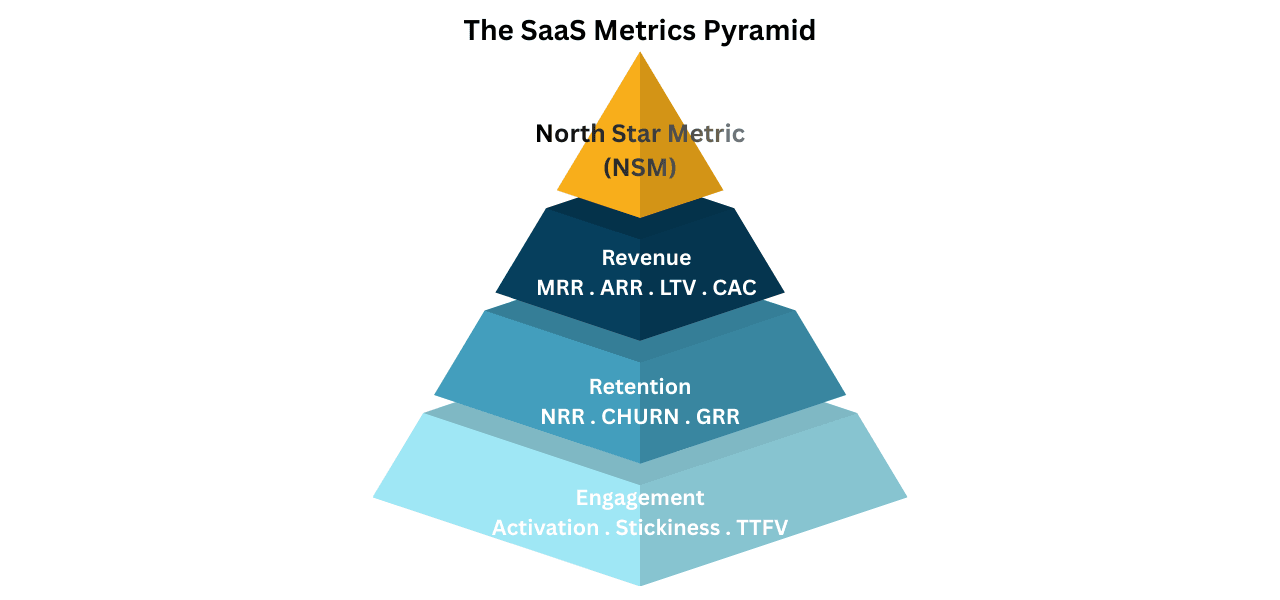
The North Star Metric
Before we dive into the dozens of metrics you could track, let’s talk about the one you should track.
Every great SaaS company has a North Star metric—a single number that captures the core value they deliver to customers.
- Spotify tracks “Time spent listening.”
- Airbnb tracks “Nights booked.”
- Slack tracks “Messages sent.”
Notice something? None of these are revenue metrics. They’re usage metrics. Because revenue follows value. If you’re delivering value consistently, money shows up.
Your North Star should be:
- Leading, not lagging (it predicts revenue, doesn’t just report it)
- Actionable (your team can influence it daily)
- Value-aligned (when it goes up, customers win)
For a B2B SaaS company, your North Star might be “Weekly Active Users” or “Features Used per Customer.” For a transaction platform, it might be “Transactions Processed.”
Find yours. Put it on a dashboard that everyone sees. Make it the heartbeat of your company.
Revenue Metrics: The Basics You Can’t Ignore
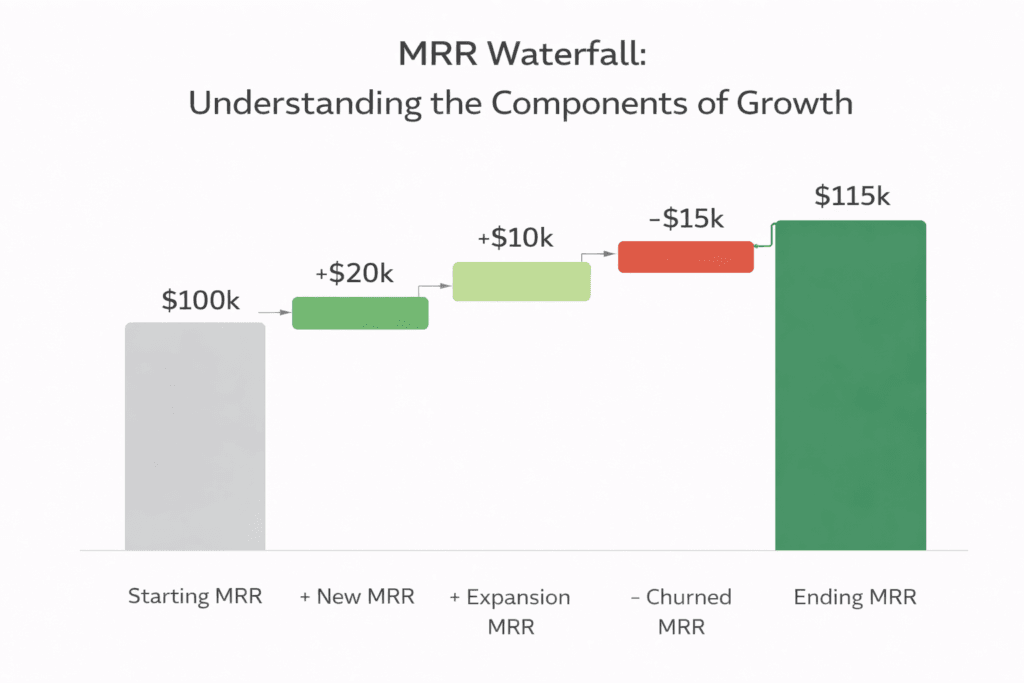
Monthly Recurring Revenue (MRR)
MRR is the lifeblood of SaaS. It’s predictable, recurring revenue you can count on every month.
The formula is simple:
MRR = Number of Customers × Average Revenue Per Customer
But here’s where founders get tripped up: MRR has layers.
You need to track:
- New MRR – From brand new customers
- Expansion MRR – From upgrades, add-ons, seat increases
- Churned MRR – From cancellations and downgrades
- Net New MRR – New + Expansion – Churn
Real talk: If you’re not tracking these separately, you don’t know if your growth is healthy or fragile.
A company adding $50k in new MRR but losing $40k to churn is treading water. A company adding $30k new MRR with $5k churn is building momentum.
Annual Recurring Revenue (ARR)
ARR is just MRR × 12. It’s how investors think, especially as you grow past $1M ARR.
Pro tip: When you talk to investors, use ARR. When you talk to your team about daily execution, use MRR. Both matter, but for different audiences.
Average Revenue Per Account (ARPA)
ARPA tells you your average customer value.
ARPA = Total MRR / Total Customers
This metric shapes everything:
- Low ARPA ($10-50/month) → You need massive volume, self-service onboarding
- Medium ARPA ($100-500/month) → You can afford some sales touch, need product-led growth
- High ARPA ($1000+/month) → Enterprise sales, implementation teams, high-touch support
Where most founders go wrong: They build a sales process for high ARPA but price for low ARPA. Or they build self-service for enterprise pricing. Your ARPA should dictate your go-to-market motion, not the other way around.
Customer Economics: Where Businesses Live or Die
Customer Acquisition Cost (CAC)
CAC is the cost you incur to acquire one paying customer.
CAC = Total Sales & Marketing Spend / New Customers Acquired
But—and this is critical—what counts as “Sales & Marketing Spend”?
Include:
- Ad spend
- Content creation costs
- Salaries for sales and marketing team
- Software tools for sales/marketing
- Agency fees
- Events and sponsorships
Exclude:
- Product development (that’s R&D, not acquisition)
- General overhead
- Customer support (that’s retention)
The trap: Many founders undercount CAC by excluding salaries or tools. Be honest. You’re only cheating yourself.
Lifetime Value (LTV)
LTV is the total revenue you’ll get from a customer before they leave.
The simplest formula:
LTV = ARPA × Gross Margin × Customer Lifetime
Where Customer Lifetime = 1 / Monthly Churn Rate
Example:
- ARPA = $100/month
- Gross Margin = 80%
- Monthly Churn = 2% (lifetime = 1/0.02 = 50 months)
- LTV = $100 × 0.8 × 50 = $4,000
The LTV:CAC Ratio (The Investor’s Favorite)
This is the big one. The relationship between what you spend to acquire a customer and what they’re worth.
The rule of thumb:
- < 1:1 – You’re destroying value (spend more than you get back)
- 1:1 to 3:1 – You’re acquiring customers, but inefficiently
- 3:1 – The sweet spot (healthy, scalable business)
- > 5:1 – You might be under-investing in growth
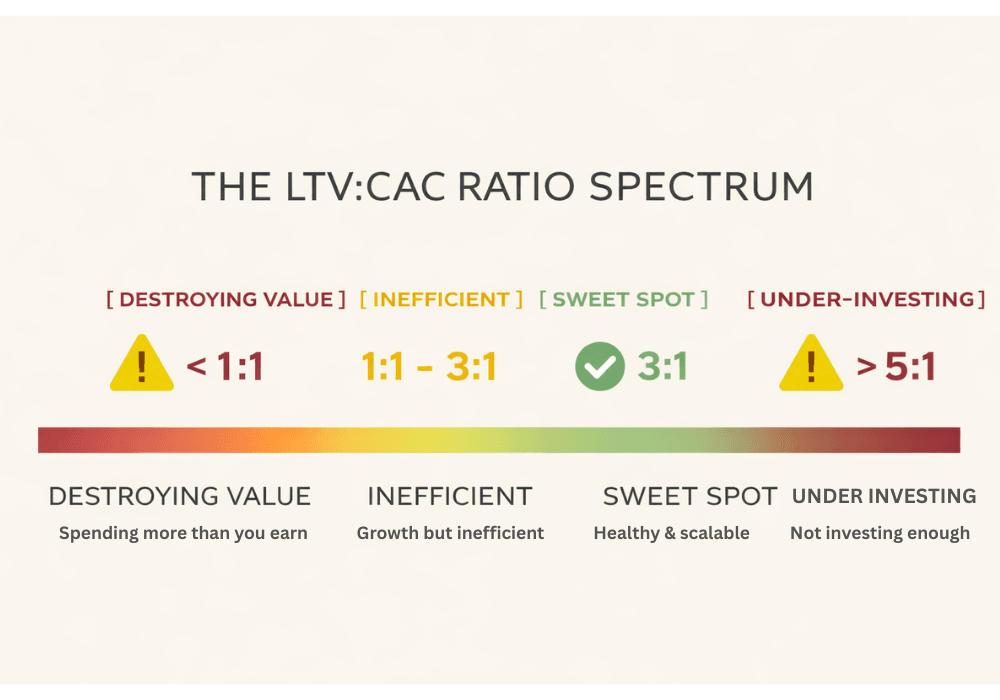
THE LTV:CAC RATIO SPECTRUM
[ DESTROYING VALUE ] [ INEFFICIENT ] [ SWEET SPOT ] [ UNDER-INVESTING ]
< 1:1 1:1 – 3:1 3:1 > 5:1
Reality check: Early-stage SaaS often runs below 3:1. That’s fine. But if you’re still below 3:1 at $2M ARR, you have a problem.
CAC Payback Period
How many months to earn back what you spent to acquire a customer?
CAC Payback Period = CAC / (ARPA × Gross Margin)
Benchmarks:
- < 12 months – Excellent (enterprise SaaS)
- 12-18 months – Good (SMB SaaS)
- 18-24 months – Acceptable (high-volume, low-touch)
- > 24 months – Risky (needs deep pockets)
CAC PAYBACK PERIOD SPECTRUM
[ EXCELLENT ] [ GOOD ] [ ACCEPTABLE ] [ RISKY ]
< 12 months 12-18 18-24 > 24 months
What it means:
• < 12 months → You recover acquisition cost quickly. Healthy.
• 12-18 months → Acceptable for SMB SaaS.
• 18-24 months → Works for high-volume, low-touch models.
• > 24 months → Needs deep pockets. Fix urgently.
Why this matters: If it takes 24 months to pay back CAC, you need 24 months of runway to break even on your acquisition spend. That’s a lot of capital.
Retention Metrics: The Hidden Growth Engine
Logo Churn vs Revenue Churn
This distinction changes how you see your business.
- Logo Churn = Percentage of customers who cancel
- Revenue Churn = Percentage of revenue lost
If you lose 10 small customers ($50/month each) but gain one enterprise customer ($5000/month), your logo churn looks bad but your revenue churn looks great.
Which matters more? Both. But early-stage founders obsess too much on logo churn and miss opportunities to expand revenue.
Gross Revenue Retention (GRR)
GRR measures revenue retained from existing customers, excluding expansions or upsells.
GRR = (Starting MRR – Churned MRR – Downgrade MRR) / Starting MRR
GRR only goes down. It’s a pure retention measure.
Benchmarks:
- 90%+ – World-class
- 85-90% – Good
- 80-85% – Acceptable
- < 80% – Problematic
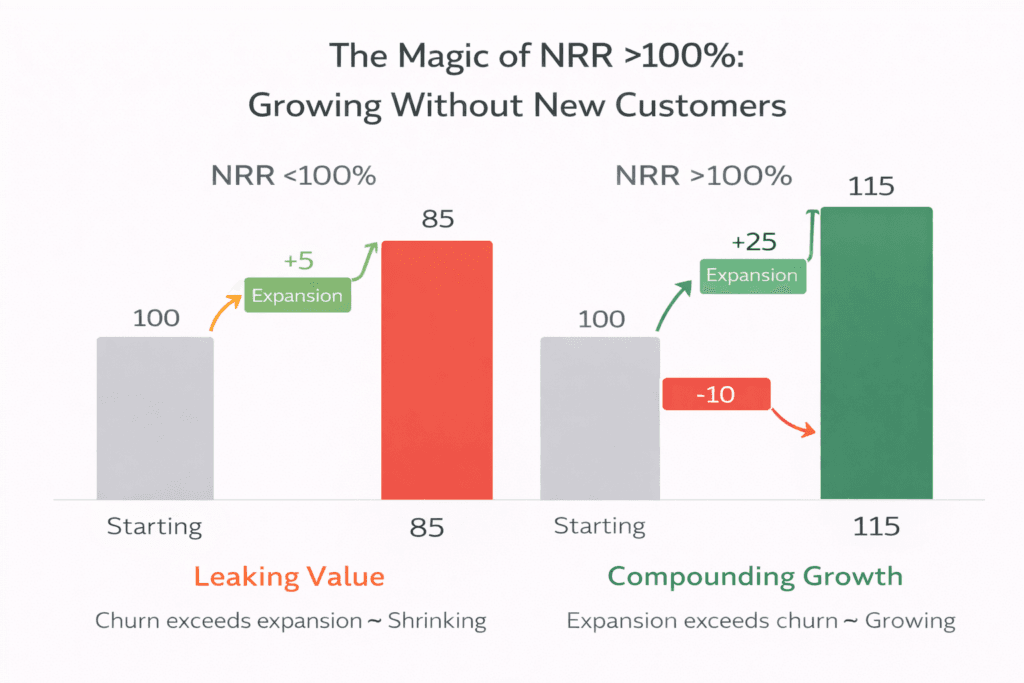
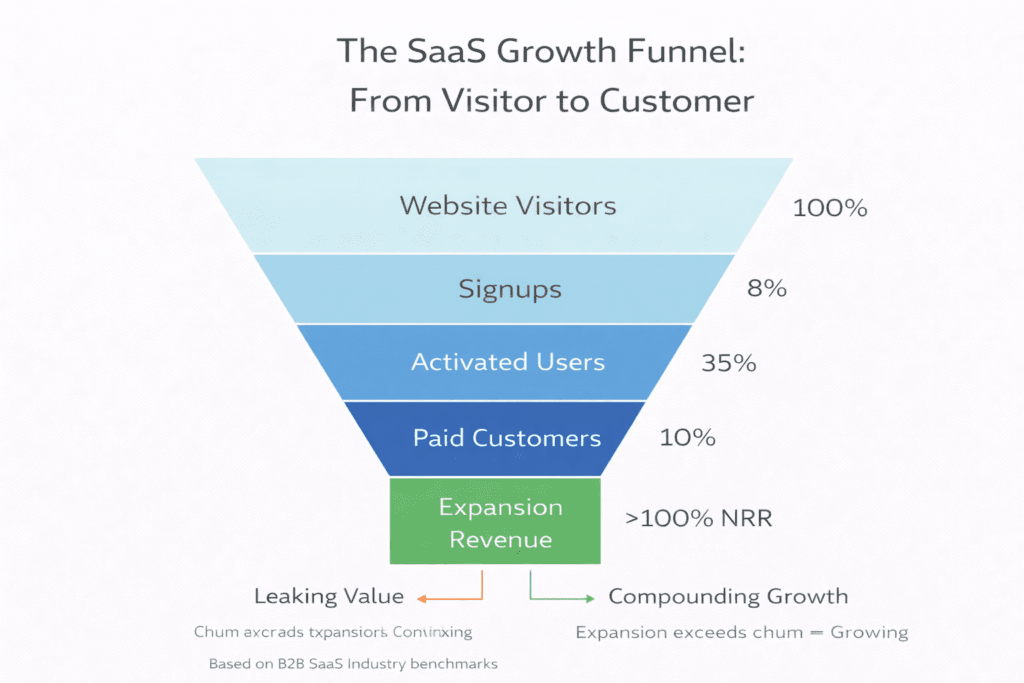
Net Revenue Retention (NRR)
NRR includes expansion revenue. This is where SaaS magic happens.
NRR = (Starting MRR + Expansion MRR – Churned MRR – Downgrade MRR) / Starting MRR
The holy grail: NRR > 100%. This means your existing customers are growing faster than you’re losing them.
What great looks like:
- 120%+ – Elite (Snowflake, Slack in early days)
- 110-120% – Excellent
- 100-110% – Good
- < 100% – You’re leaking value
The insight: If your NRR is >100%, you can lose money on acquisition and still build a massive business. Why? Because customers become more valuable over time. The math works.
Engagement Metrics: Leading Indicators
Daily Active Users / Monthly Active Users (DAU/MAU)
For product-led SaaS, this is oxygen.
Stickiness = DAU/MAU
- 20%+ – Good (people use your product weekly)
- 40%+ – Excellent (people use it multiple times weekly)
- 60%+ – Exceptional (people use it almost daily)
The question: Does your product need daily use? A payroll platform is used monthly. A project management tool should be used daily. Know your category.
Time to First Value (TTFV)
How long from signup to first “aha” moment?
This is the most underrated metric in SaaS.
If it takes 3 days to get value, you’ll lose 50% of trials. If it takes 3 minutes, you’ll keep them.
Examples:
- Canva: First design in 60 seconds
- Calendly: First booking in 2 minutes
- Slack: First message in 30 seconds
Your job: Obsess over shrinking TTFV. Demo the product yourself and time it. Then cut the time in half. Then do it again.
Activation Rate
Percentage of signups who reach a key milestone (usually within the first session).
For most SaaS, this is more important than signup volume.
The math: 1000 signups × 10% activation = 100 activated users. 500 signups × 40% activation = 200 activated users.
Which would you rather have?
SaaS Benchmarks 2026: What Good Looks Like by Stage
This table synthesises data from industry reports (OpenView, ProfitWell, Pacific Crest) to provide realistic targets for your stage.
| Metric | Seed Stage (0-10 customers) | Series A (10-100) | Series B (100-1000) | Series C+ (1000+) |
| MRR Growth (Monthly) | 15-20% | 10-15% | 5-10% | <5% |
| CAC | Hard to measure | < $500 (SMB) | $500-$2,000 | $2,000+ |
| LTV:CAC | Not applicable | > 2:1 | > 3:1 | > 3:1 |
| CAC Payback (months) | N/A | < 18 | < 15 | < 12 |
| Logo Churn (Monthly) | < 5% | < 3% | < 2% | < 1.5% |
| NRR | < 90% | 90-100% | 100-110% | 110%+ |
| Activation Rate | Varies | > 25% | > 35% | > 40% |
Note: Benchmarks vary by business model and target customer. Use these as directional guides, not absolute targets.
The Metrics That Matter by Stage
Seed Stage (0-10 Customers)
Track:
- North Star metric (usage, engagement)
- Customer feedback (qualitative > quantitative)
- Activation rate
Why: You’re still finding product-market fit. Hard metrics will be noisy. Listen to users.
Series A (10-100 Customers)
Track:
- MRR growth rate
- Activation rate
- Early cohort retention
- CAC (roughly)
Why: You need to prove repeatability. Show that customers stick and you can acquire them consistently.
Series B (100-1000 Customers)
Track:
- LTV:CAC
- NRR
- Payback period
- Churn by cohort
Why: You’re scaling. Efficiency matters. Investors want to see unit economics that work at scale.
Series C+ (1000+ Customers)
Track:
- Everything above, segmented by:
- Customer size (SMB vs Mid-market vs Enterprise)
- Acquisition channel
- Product line
- Geography
Why: Growth hides problems. Segmentation reveals them.
Common Metrics Mistakes (And How to Avoid Them)
Mistake 1: Celebrating Vanity Metrics
Total registered users mean nothing if they never log in. Blog traffic means nothing if it doesn’t convert. Focus on metrics that correlate with revenue.
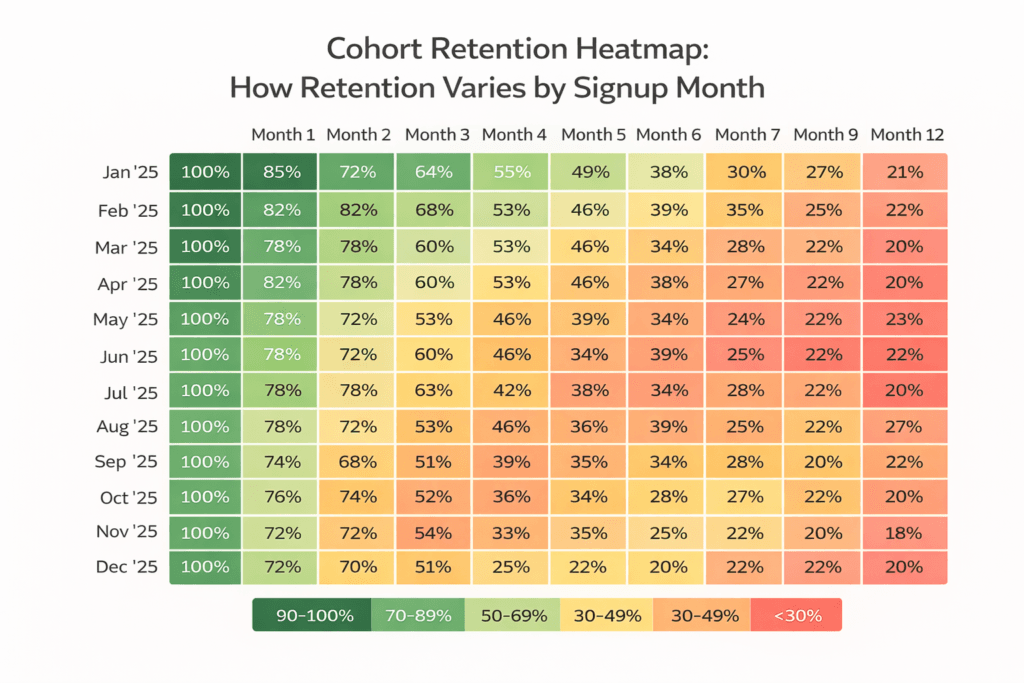
Mistake 2: Ignoring Cohort Analysis
Averages lie. Your overall churn might look fine (5%), but if customers from 6 months ago are churning at 15%, you have a problem that averages hide.
Fix: Always look at churn by cohort (customers who joined in the same month). Track how each cohort behaves over time.
Mistake 3: Misaligned Time Periods
Comparing this month’s new MRR to last month’s total MRR. Comparing CAC calculated quarterly to LTV calculated annually. Align your timeframes.
Mistake 4: Not Segmenting
Enterprise customers behave differently from SMB customers. Organic customers behave differently from paid. Segment everything.
Mistake 5: Analysis Paralysis
You don’t need 50 metrics. You need 5-10 that tell the real story. Track the rest, but put the critical few on your dashboard.
Tools for Tracking SaaS Metrics
You could build this in spreadsheets (and should, early on). But eventually, you’ll want dedicated tools:
- ProfitWell / ChartMogul / Baremetrics – Subscription analytics, MRR tracking, churn analysis
- Amplitude / Mixpanel – Product analytics, activation, engagement
- Tableau / Looker – BI for custom dashboards
- Excel / Google Sheets – Honestly, still works for early stage
Building Your Stack:
- CRM platforms also track customer data that feeds into these metrics. For a deeper look, see our Best CRM for SaaS Startups guide.
- Marketing automation tools can help improve activation and retention. Explore our Best Marketing Automation Tools comparison.
- AI tools are increasingly used to predict LTV and churn. Read our Best AI Tools for SaaS Startups guide.
- Workflow automation tools connect your metrics stack. See our Best Workflow Automation Tools guide.
For a complete overview of how all these tools fit together, read our SaaS Growth Stack. The Tools Every Startup Needs in 2026 guide.
Key Takeaways
LTV:CAC is your primary efficiency indicator. Aim for 3:1.k
NRR > 100% means your revenue compounds without new customers.
CAC Payback < 18 months keeps your runway healthy.
Activation rate matters more than raw signup volume.
Cohort analysis reveals problems that averages hide.
Segmentation is the key to understanding your business at scale.
Final Takeaway
Here’s what I wish someone had told me before that investor meeting:
Metrics aren’t scorekeeping. They’re navigation.
Each number tells you something about where you are and where you’re going:
- High churn? Your product or pricing is wrong.
- Low activation? Your onboarding is broken.
- CAC too high? Your marketing or sales motion is inefficient.
- LTV too low? You’re not retaining or expanding enough.
The goal isn’t to hit perfect numbers. It’s to see clearly enough to fix what’s broken.
Start with your North Star. Add revenue metrics. Watch retention like it’s your only child. And remember—every metric is just a question in disguise. Your job is to answer it.
This framework—from Engagement to North Star—is the foundation of the Automaiva SaaS Growth System. Mastering these metrics is the first step to building a scalable business.
For a complete overview of how all these tools fit together, read our SaaS Growth Stack: The Tools Every Startup Needs in 2026 guide.
Download the SaaS Metrics Cheat Sheet
Get a one-page PDF with all formulas, benchmarks, and a template dashboard.
Disclaimer:
The metrics, formulas, and benchmarks in this guide are based on widely accepted SaaS industry standards. However, every business is unique. Benchmarks vary by industry, business model, company stage, and geography. Use these as directional guidance, not absolute rules.
Pricing Information: All prices mentioned for tools and platforms are approximate and based on information available at the time of writing (March 2026). Software pricing changes frequently based on feature updates, regional differences, and promotional offers. Always check the official website for current pricing.
For specific financial, investment, or purchasing advice, consult a qualified professional.
Written by the Automaiva Editorial Team
Automaiva publishes research-based insights on AI tools, SaaS platforms, and automation systems used by modern startups. Our editorial team analyses SaaS tools, automation workflows, and emerging software trends to help founders choose the right technology stack.
Editorial Policy · Suggest a Topic
Join founders reading Automaiva for weekly SaaS insights on AI tools, automation workflows, and growth stacks.
Love this content? Get more……….
Categories: SaaS Growth Stack
Tags: analytics, founder guides, SaaS benchmarks, SaaS KPIs, SaaS metrics, startup growth